

Premier League clubs’ £1bn losses in 11 charts
It has been called “the season of asterisks” but, with Premier League charges and points deductions dominating the news agenda, understanding football finances has become crucial for fans.
Everton and Nottingham Forest’s rule breaches off the pitch could have a big say in the relegation battle on it, while Wolves, Aston Villa and Leicester have posted eye-watering losses in recent weeks.
With the help of football finance expert Kieran Maguire and his database of club accounts up to 2023, BBC Sport attempts to break down the overall Premier League picture in 11 charts.
At the time of publication, full 2023 accounts were unavailable for Chelsea, Crystal Palace, Fulham and Leeds, so their figures are based on 2022 accounts. Fulham’s accounts are therefore from their Championship season 2021-2022. We will update the article when those accounts are published on Companies House.
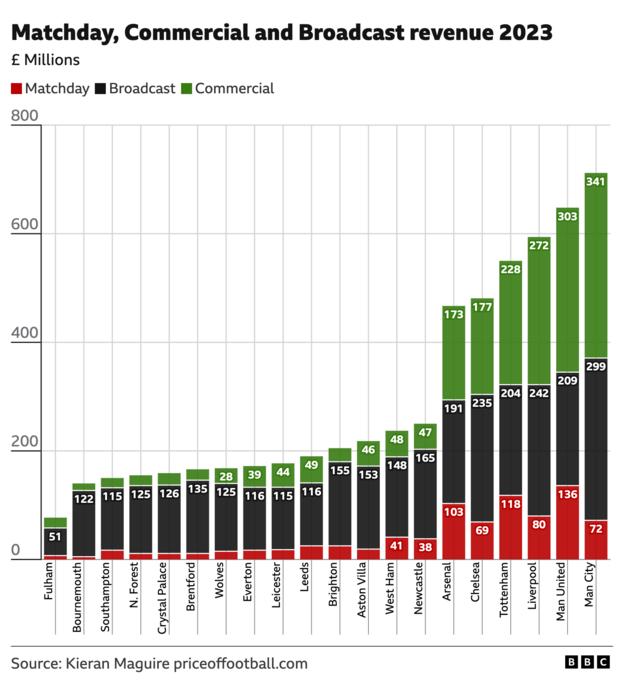
1 & 2. Revenues
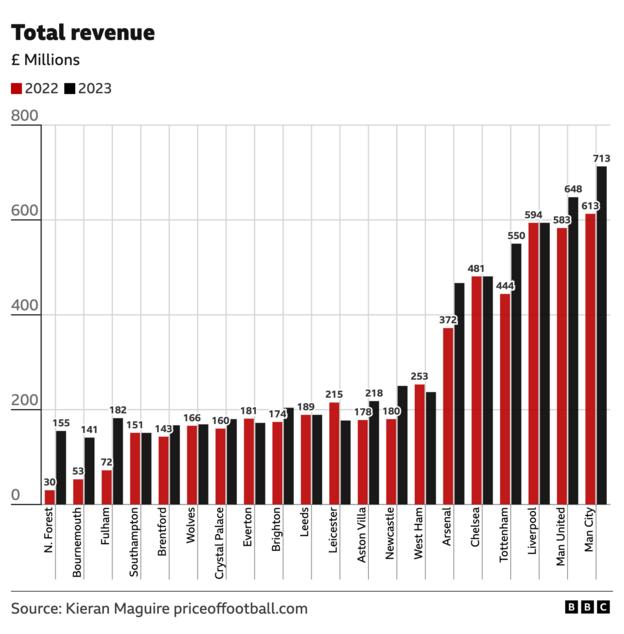
“The Premier League has been spectacularly successful since it started in 1992,” says Maguire. “Since that time consumer prices have increased by about 112% but Premier League revenues have increased by 2,800%.
“Clubs generate their revenue from three main sources: matchday, broadcast and commercial/sponsorship.”
The combination of European football, higher Premier League merit payments and bigger stadiums show the gap between Newcastle and the ‘big six’ of Manchester City, Manchester United, Liverpool, Chelsea, Arsenal and Tottenham.
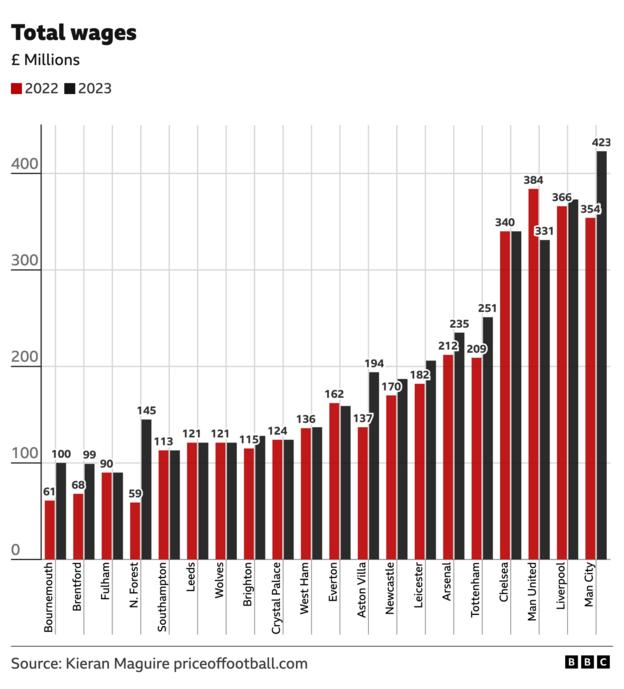
3. Total wages
Wages are the biggest day-to-day running cost at a club.
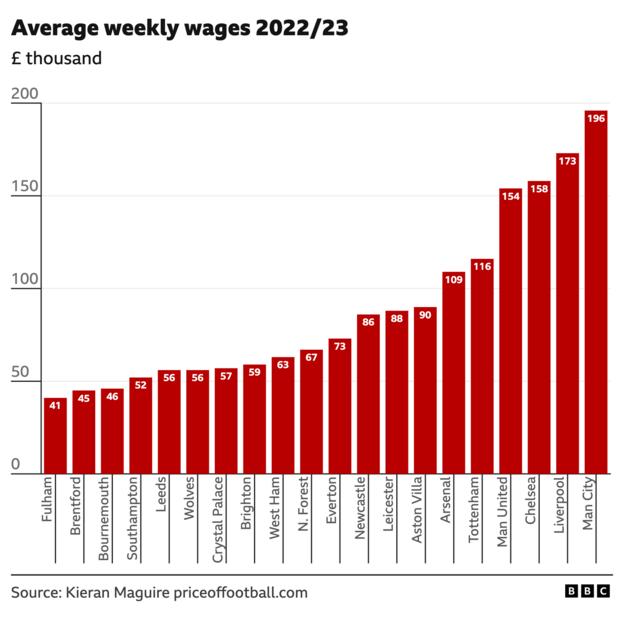
Maguire says there is “an extremely high correlation between wages and final league position”, but the following charts show the obvious risk and challenge for Leicester, who were relegated with the seventh highest wage bill in 2023.
4. Average weekly wages
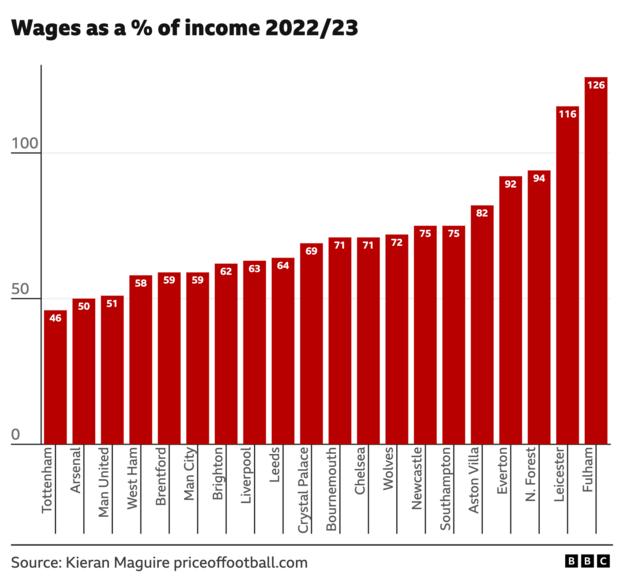
5. Wages as a percentage of income
Why is all this data on wages important?
Uefa’s new Financial Fair Play (FFP) measures allow clubs which compete in their competitions to spend 90% of their income on wages, transfers and agents fees in 2023-24, reducing to 80% in 2024-25 and 70% in 2025-26.
The Premier League could follow a similar ratio if it votes to change its financial rules for 2024-25.
Interestingly – Fulham’s 2022 Championship season accounts aside – Leicester, Everton and Forest all top this chart, having all faced Premier League Profit and Sustainability (PSR) charges…
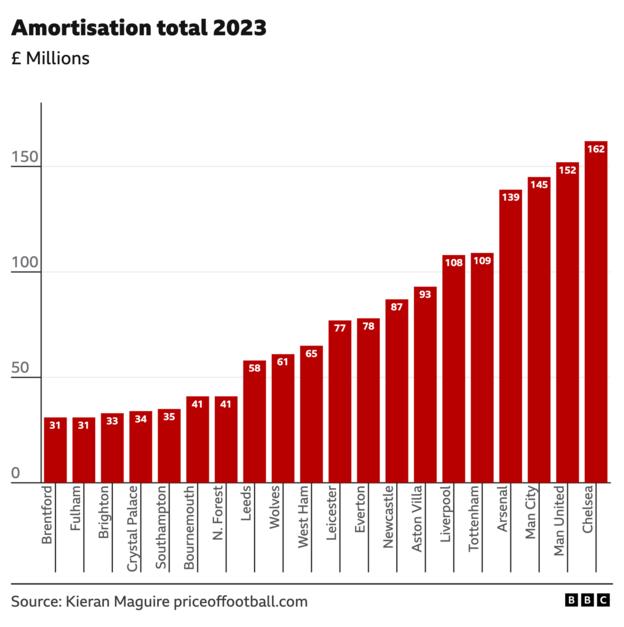
6. Amortisation
Chelsea’s strategy under owner Todd Boehly of signing expensive young players on long contracts to spread the cost introduced the word ‘amortisation’ to the footballing lexicon.
Enzo Fernandez’s eight-year deal as part of his £106m transfer was one high-profile example.
This graph shows total amortisation cost for the financial year and relates to all the players in the squad who have been signed for transfer fees. It counts as a cost on Premier League profit and sustainability (PSR) accounts.
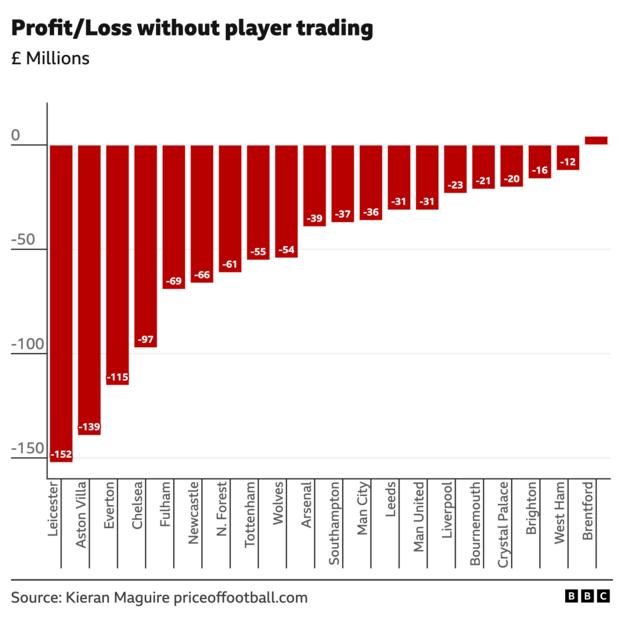
7 & 8. Profit/loss
Maguire says wages and transfer fees absorb about 90% of total Premier League revenue across all 20 clubs, with most clubs losing money day-to-day. Selling players or relying on owner generosity are the only way to cover the losses.
“It cost former Chelsea owner Roman Abramovich about £900,000 a week for 19 years in terms of interest-free loans to cover the club’s losses,” Maguire said.
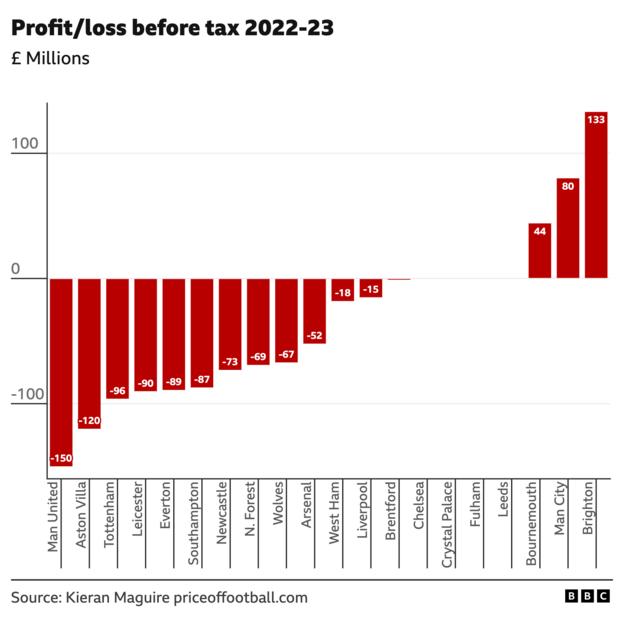
In their press releases on finances, clubs often declare a profit before tax (PBT) figure – which includes players being sold or bought – such as Bournemouth’s £44m profit or Everton’s £89m loss.
Maguire’s figures also show a separate, more stark profit and loss chart for 2022-23, where the money recouped from player sales is excluded due to it being a “volatile”, unpredictable market.
In this chart, only Brentford (£4m) made a profit from day-to-day trading and the total losses of the 20 Premier League clubs were about £1bn – even without the 2023 accounts of big-spending Chelsea, Crystal Palace, Leeds and Fulham.
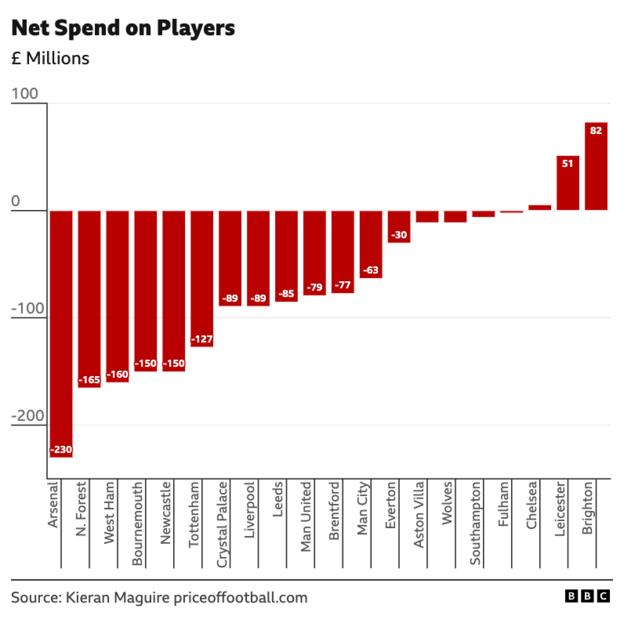
9. Player trading
As BBC Sport reported this week, Brighton’s profits of £123m after tax for 2022-23 were a Premier League record – and did not even include the combined £125m sale of Moises Caicedo and Roberto Sanchez to Chelsea.
They were one of very few Premier League clubs not to record a negative net spend from player trading, underlining the difficulty of executing owner Tony Bloom and chief executive Paul Barber’s strategy.
10. Total squad costs
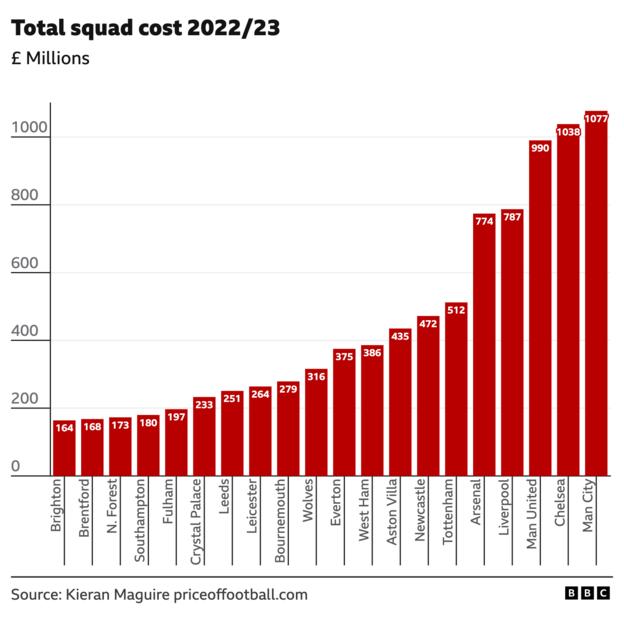
Another chart, like wages and revenue, that reflects the strength of the ‘big six’.
Maguire says: “At the end of 2022-23 Premier League clubs had invested over £9bn on transfer fees, building their squads over the years, with both Manchester City and Chelsea spending more than £1bn each.”
Here’s a further table to illustrate that £9bn figure…
A 10-year report from the CIES Football Observatory report on the highest net-spending clubs in the world since 2014 shows Premier League net spending compared to some of the European giants.
| Highest net spending (2014-2023) | |
|---|---|
| 1. Manchester United – £1,196.6m | 11. Aston Villa – £414.3m |
| 2. Chelsea – £885.5m | 12. Liverpool – £395.3m |
| 3. Paris St-Germain – £865.8m | 13. Al-Hilal – £391.3m |
| 4. Arsenal – £746.9m | 14. Juventus – £385m |
| 5. Manchester City – £733.8m | 15. Everton – £336.1m |
| 6. Newcastle United – £575.2m | 16. Crystal Palace – £322.3m |
| 7. Barcelona – £568.4m | 17. Bournemouth – £294.9m |
| 8. Tottenham – £522.1m | 18. Bayern Munich – £294.1m |
| 9. AC Milan – £467.3m | 19. Real Madrid – £277.6m |
| 10. West Ham – £451.9m | 20. Nottingham Forest – £265.8m |
| Stats from CIES Football Observatory Monthly Report | |
Since 2014 the Premier League’s combined net spend is more than £9.5bn, the Chinese Super League is second with £1.14bn, and the Saudi Pro League is third with a net spend of about £1.13bn.
In comparison, the Portuguese Primeira Liga made a profit of about £1.9bn on player transfers in the same period.
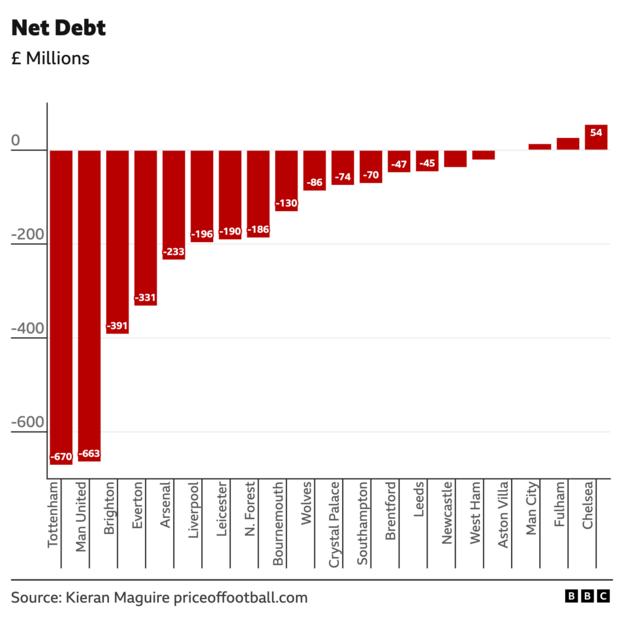
11. Total debt
And to the big one….
Football is an expensive business. And then there is the significant borrowing of clubs such as Manchester United or Tottenham for their new stadium.
“Net debt is the total amount of borrowings that a club has, less any cash,” says Maguire.
According to his figures, current Premier League club debt levels are approximately £3.6bn…
Additional reporting by Sam Chadderton. Visual Journalism by Lee Martin.
Add Comment